Video-powered fleet insurance
Use real-time footage and telematics to reduce claims and premiums.
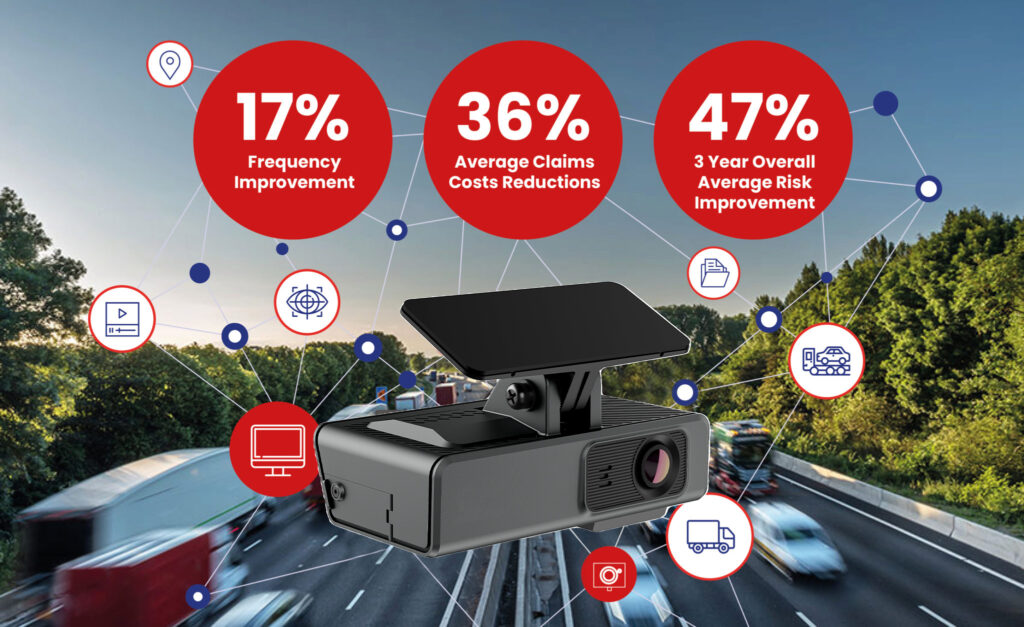
Insurance meets telematics
Camatics brings together insurance and video telematics, delivering insights on driver behaviour, journey data and accident evidence to reward safer fleets. With potential premium reductions of up to 20%, it’s designed for operators who want active control of risk.
Why choose Camatics?
Camatics is insurance fused with CCTV technology accelerates claims reporting & drives down costs.
Lower costs help risks achieve year on year premium reductions of up to 20%.
Make your Finance Director’s day
We know how you pay for your fleet insurance has a big effect on your business. That’s why we think about it like it’s part of the product itself. Whether that’s smart contracts that help you plan, or finance solution, we’ve got you covered, and then some!
Long-term agreement available
Premium Finance
What next?
If you’re new to Camatics, brokers can contact us to arrange a demonstration plus get a quote. For existing Camatics customers, visit the Camatics portal.